
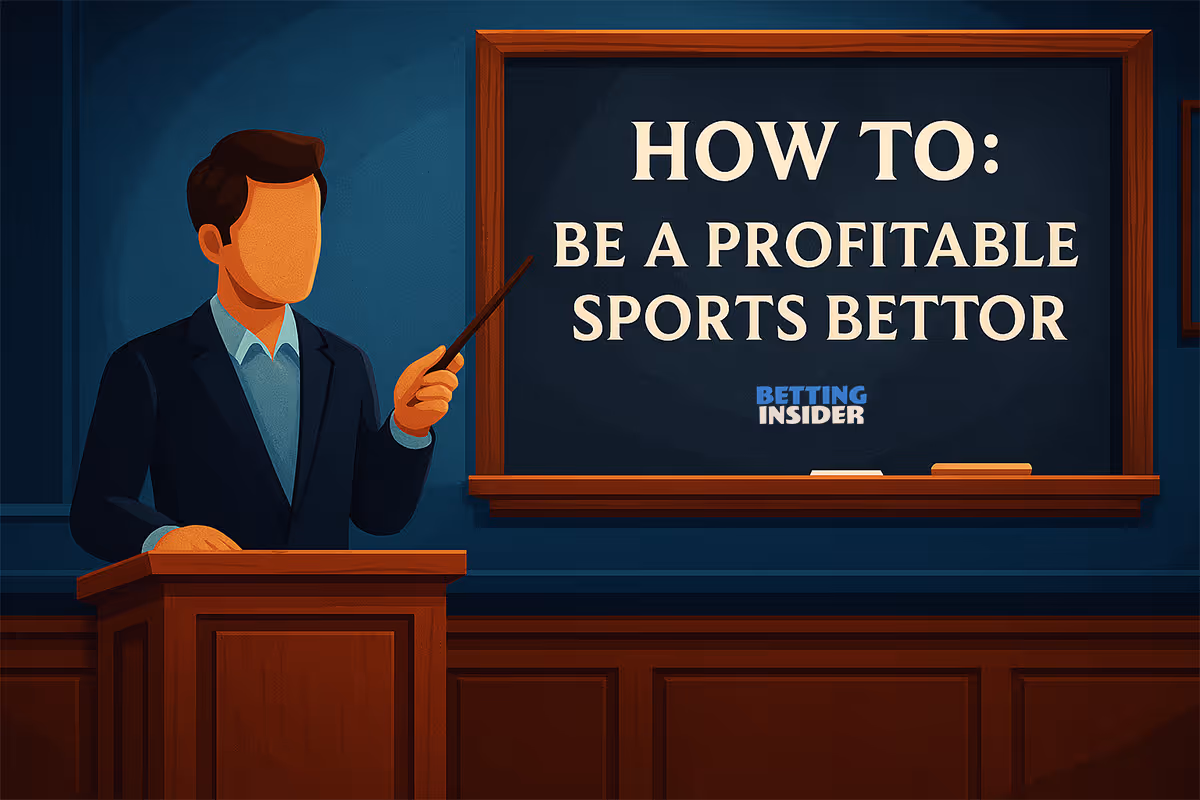
Smart Betting That Compounds: A Real Betting Guide To Building Your Bankroll
I’ve gone 63.49% on 189 free plays on X. On my personal card, where the volume is much higher, I sit between 57% and 60% month after month, year after year. Everyone on our Insider team lives in that same neighborhood because the process is tight: market first, systems second, player and team context third, price last, all wrapped in strict bankroll management. If you came here searching how to make money sports betting or how to build a bankroll, this is the version that actually scales.
Patience, Singles, No Chasing
If you cannot be patient, your bankroll never grows. The 2 fastest ways to leak money are chasing after a loss and parlays. Chasing means rushing your next bet or hiking your unit size to “get it back.” Parlays are fun but they make up a huge share of sportsbook profit. My card is singles almost every time. There are rare exceptions that deserve a seat at the table, like true Wong teasers in the NFL when the numbers qualify, or carefully built alternate prop parlays when you have a defined edge. Insider Mike, our prop specialist, is good at that. Treat them as exceptions, not a lifestyle.
How I Read The Market
I’m a late bettor. I let books show their hand, then I act. I’m not trying to move openers with 5-figure hits. My edge is catching the right side of the move after sharper money speaks.
Most of my card is contrarian. Roughly 7 of every 10 bets I place are against the heavy public side. When the public is loaded up on 1 team or total and the line either refuses to move or nudges toward the unpopular side, I consider that Vegas-backed. It’s reverse line movement, and it’s 1 of the cleanest signals you’ll find. As a baseline example, my tracking on Vegas-backed MLB unders this season is about 58%. It is not the whole strategy, but it is a profitable filter.
When I decide to ride with the more public side, which is about 25% of my volume, I still need validation from the number. If the line will not move in that direction, or worse, if it ticks against it, I pass. Market respect matters either way.
People always ask about CLV. I’m roughly 60–40 on the positive side, but I do not worship it. If I lose a half-point to a late nudge and the read is still right, I’m fine. CLV is a scoreboard. The game is the market plus context.
The Stack I Actually Use
Free tools still matter. I use ESPN, StatMuse, and TeamRankings constantly for player and team context. If you want to place smart bets consistently, add 1 paid, betting-specific data source and learn it cold. 1 is enough to start.
Insider Stats is my daily hub. It’s 29.99 per month with a 1-dollar trial. We did not raise money to build it. We invested our own cash and took our lumps to make something I wanted for my own card. It tracks public betting splits and line movement across more than 35 sportsbooks for every sport and for moneylines, spreads, and totals. It also surfaces historical team betting data and referee or umpire tendencies in a 5-year window based on the exact game factors in front of you, plus clean side-by-side team comparisons for this season and the last 3. You have probably seen my screenshots where the indicators flag a Vegas-backed underdog. That is this tool doing its job. The prop module is coming and I am excited for it.
Trends Center is also 29.99 per month and it is a fast system builder. You can test a scenario in seconds. For example, home starting pitcher ERA under 4, home team off a loss, home as a small favorite, opponent starting a road trip. You get current season and all-time record, win rate, ROI, and streaks. There is a feed of pre-built systems from their pros that updates often. For getting your system library off the ground, it is perfect.
KillerSports has a free tier and a 79.99 premium tier. Free lets you run up to 10 queries per sport and save 2 per sport. Queries are systems built in SDQL. It is powerful and covers a lot of the same ground as Action Labs, but it is more technical and the workflow can feel blocky. If you enjoy tinkering, it is a strong option.
Action Labs is 249.99 per month and the most polished system builder I use. The “Build” flow is simple, everything autosaves, and live “Signals” and “Reports” help you see deeper public-betting moves. Their splits sometimes differ from the Action App because Labs pulls more books. It is expensive, and the education around pro systems is lighter than I would like, but if you manage 100s of systems, the time you save is real.
If you insist on starting free for splits, Sports Betting Dime is usable but limited. The Action App’s indicators and splits sit around 19.99 and are fine for getting your feet wet.
Across our Insider team, we have built more than 6,000 systems across platforms. You do not need that on day 1. Over time you will accumulate 100s and your reads will get layered and fast.
How I Build Systems That Hold Up
I build systems 2 ways. The 1st is to reverse-engineer obvious wins. When a game smashes, I ask why. Was the weather cold for that sport. Did both teams come in off a loss. Was this a division game with familiarity. Did the total land in a specific band. Did the market steam 1 direction all day. Did the starting pitcher’s profile match the lineup poorly. Was the home bullpen rested. I translate those into testable game factors and betting factors, then I keep only what holds up across seasons.
The 2nd way is to test clear hypotheses. What is the under rate in domes after a low-scoring opener. What happens when a home team is off a shutout, the opponent starts a road trip, and the total sits in the upper quartile for that league. I test these in Action Labs or Trendcenter, validate both current and all-time, and only then add them to my library.
I like market confirmation inside a system but I do not let it dominate. A simple, durable template for totals is environment first, market confirmation second, team context third, player form last. For instance, colder relative temps or a travel spot, then a total that has dropped from open with fewer than 40% of tickets on the under, followed by divisional familiarity or both teams off a loss, then starter form and bullpen freshness. Public and movement elements are valuable, but they should only make up a small slice of your overall system universe. 10 to 15 percent is a good ceiling.
When systems are active on both sides of a game, I either pass or compare long-term ROI and recency fit. Volume matters only when it is informed.
Player And Team Context Is The Finisher
Systems get you to plus-EV. Player and team detail often gets you across the finish line. In baseball I study the starter’s arsenal against the opponent’s profiles, bullpen usage over the last 3 to 5 games, park factors, platoons, and even baserunning pressure. In football I look at quarterback health and past results against the specific defensive structures he is about to face, expected pass rate given weather and script, trench mismatches, and late-season motives like playoff pushes, locked seeds, or tanking.
A recent example was Rays at Athletics under 9.5 at +100. Part of the cap was Jacob Lopez facing his former team for the 1st time. He already had serviceable baseline numbers, but motivation and familiarity can tilt the edge. He threw 7 scoreless with 9 strikeouts and the under cashed. I care about market signals and systems, but the right player detail turns good into great.
I also pay attention to live price stories. If an overnight total moves from plus 105 to minus 105 on the same side without a public surge behind it, I want to know why. That kind of move often pairs with the exact contrarian setups I like.
How To Build A Bankroll Without Torching It
Start with money you can isolate. 500 dollars is a clean example. Risk 1.5 percent per bet at the start. That is 7 dollars and 50 cents per wager. Cap daily exposure around 7 to 8 percent while you learn. If your slate is deeper on a given day, adjust unit size instead of overextending. Use multiple sportsbooks and shop lines. Picking up 5 cents on average compounds over a year in a way most bettors underestimate. If you need help sizing, take our bankroll quiz and lock your number.
This is bankroll management. It is not glamorous, but it is the difference between having a hot month and having a profitable year.
Start Today With A Lean, Effective Setup
Insider Stats at 30 dollars gives you accurate public splits, live line movement from many books, historical team context, and ref or ump profiles tied to the exact game. Trendcenter at 30 dollars lets you test and save systems with current and all-time records and ROI. ESPN, StatMuse, and TeamRankings cover most player and team context for free. Add a 500-dollar bankroll and you are at a total starting cost of 560 dollars. You do not need 5 tools. You need 1 you use every day and 1 you trust for system work.
The Math That Makes This Real
At odds of minus 115, break-even sits at 53.49 percent. At 55 percent you are grinding profit with singles.
Use 30 bets per week, which is about 4.25 per day. Keep the average bet at 1.5 percent of bankroll, which starts at 7 dollars and 50 cents on a 500-dollar roll. At minus 115 and a 55 percent hit rate, the weekly profile is roughly 16.5 wins and 13.5 losses, 225 dollars risked, and 6 dollars and change in net profit. That is about a 1.25 percent weekly ROI. After 4 weeks the bankroll moves from 500 to 525 and change.
Here is the modeled month-by-month curve under those same assumptions. Month 1 finishes at 525.92. Month 2 ends at 553.19. Month 3 ends at 581.87. Month 4 ends at 612.04. Month 5 ends at 643.78. Month 6 ends at 677.16. Month 7 ends at 712.26. Month 8 ends at 749.19. Month 9 ends at 788.04. Month 10 ends at 828.90. Month 11 ends at 871.87. Month 12 ends at 917.08. Month 13 lands at 964.63.
Start at 500, finish near 965, for a total profit around 465 and a yearly ROI close to 93 percent. Nudge the average price toward minus 110 and the win rate to 56 or 57 and the compounding steepens quickly. Start with 1,000 instead of 500 and the same approach scales your dollars, not just your percentages.
What I Do Every Slate
I scan public splits and line movement first. If the play is contrarian, I want the number steady or leaning toward the unpopular side. If the play is more public, I want the number to respect that side. If it does not, I pass. Then I check which of my systems are live on both teams or both sides of the total. If there is clutter on both sides I either pass or pick the side with better long-term ROI and a cleaner recency fit. Then I layer player and team context. In baseball that is starter form and pitch-to-contact profile, bullpen shape, park, and lineup fit. In football that is quarterback health, scheme matchups, trenches, and late-season incentives. Only after that do I shop the price.
Market. Systems. Context. Price. Repeat.
What To Stop Doing
Stop chasing. Stop betting because you want action. Stop trusting a line you do not understand. Stop clinging to 1 stat or 1 tool like it is gospel. Your edge is the combination, executed the same way, day after day.
This is the betting guide I live by. It is why the free plays hit 63.49 percent through 189 and why my personal card, with more volume, lives in the high 50s long-term. If you want to make money betting on sports and you want to build a bankroll that actually grows, this is the blueprint.


.avif)


.svg)